Sports Tally Chart with Automatic Graphs (Editable in Google Sheets)
R69.36
Use, by you or one client, in a single end product which end users are not charged for. The total price includes the item price and a buyer fee.
Resource Description
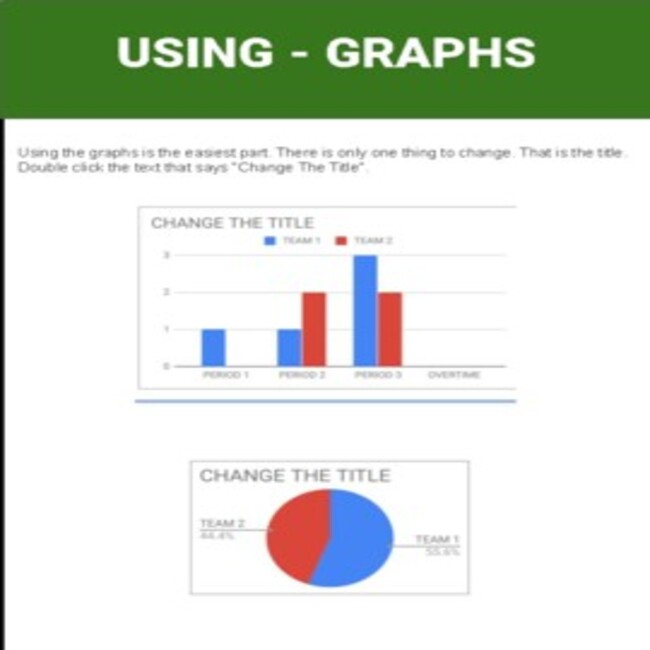
This Google Sheet is setup to create sports tally charts with automatic graphs. It is very easy to use. Students enter their data in the colored cells and the graph is automatically created. The data the students enter is the scores for each quarter, inning and or period based on the sport. This can be done watching a live sport or later looking at a box score. It is a fun way to teach graphs and math!
Included:
- 4 different sports. One on each tab. These sports include; football, baseball,basketball and hockey
- Information page on using tabs.
- Information page on using the chart.
- Information page on using the graphs.
Students will never lose their data graphs again as this uses Google Drive!


 KES(KSh)
 USD($)
 GBP(£)
 GHS(₵)
 NGN(₦)
 MUR(₨)
 BWP(P)
 AUD($)
 TZS(Sh)
 INR(₹)
 PHP(₱)
 AED(د.إ)


