Data Handling Resource Pack
Worksheets covering data handling concepts. Construct frequency tables and bar graphs. Calculate the mean, mode and median of a data set. Examples, simple instructions and practice exercises with memos.
$4
Use, by you or one client, in a single end product which end users are not charged for. The total price includes the item price and a buyer fee.
Resource Description
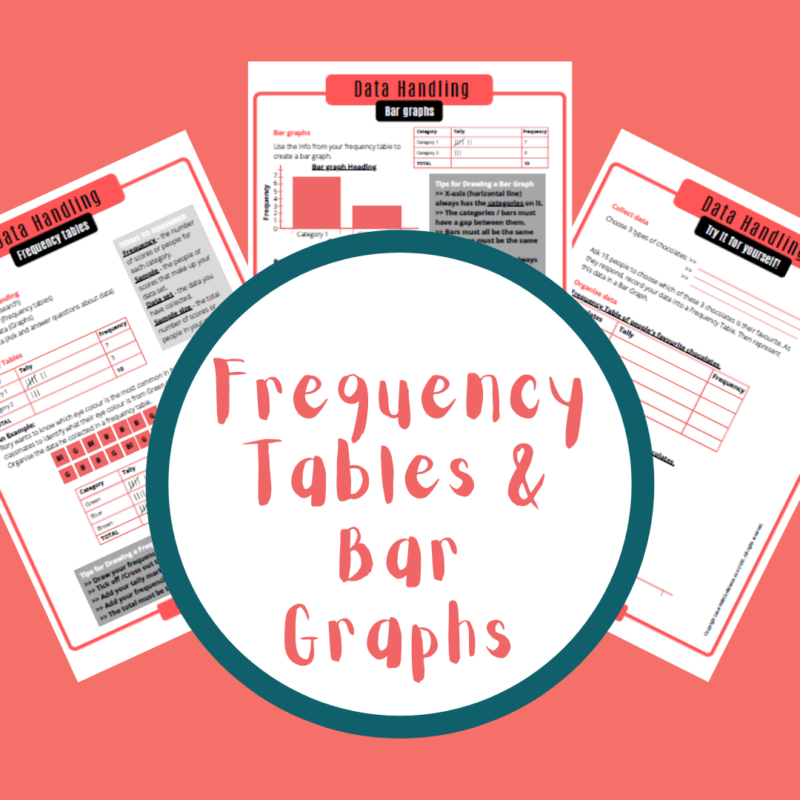
Frequency Tables and Bar graphs
Learn how to use frequency tables and bar graphs in the process of data handling.
This worksheet contains:
* Worked examples showing you the structure of frequency tables and bar graphs
* Simple explanations of how to create frequency tables and bar graphs
* Important terms to know
* Exercise to practice
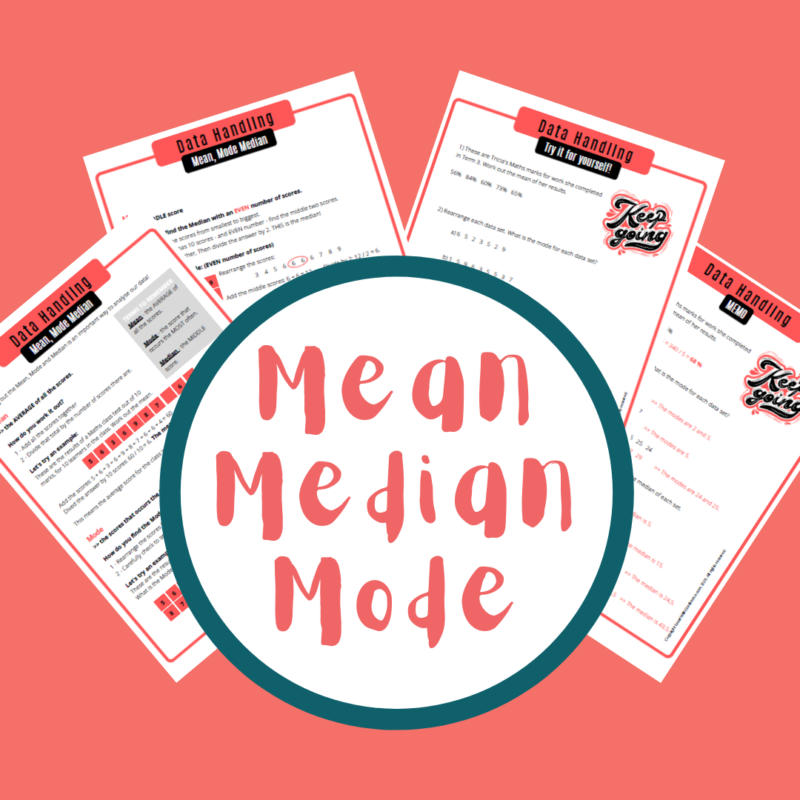
Mean, Mode and Median
Learn how to calculate the mean, mode and median of data sets.
This worksheet contains:
* Worked examples showing you how to calculate the mean, mode and median of data sets
* Simple explanations
* Important terms to know
* Exercise to practice with memo included


 KES(KSh)
 USD($)
 GBP(£)
 GHS(₵)
 NGN(₦)
 MUR(₨)
 BWP(P)
 AUD($)
 TZS(Sh)
 INR(₹)
 PHP(₱)
 AED(د.إ)